WordPress Plugin Post Volume Stats

Post Volume Stats
Wordpress plugin, "Post Volume Stats", is free to download here. It is a plugin to show the user's posting patterns - from posts-per-year to which tags are used - and display the stats in graphical form.
Post Volume Stats does the following:
-
Display the user's posting patterns (all-time and per year) in bar chart, pie chart and line graphs.
-
Widget puts bar charts of the stats into the blog sidebar.
-
Compare tags or categories' usage by plotting them on the same line graph.
-
Export the line graph and text list the stats into a post.
There is a demo video on the Post Volume Stats website and you can download the plugin at the Post Volume Stats plugin page.
Feedback
If you have downloaded and installed we'd like to say thank you.
If you would like to give me any feedback or criticism I'd love to hear it! Please go to the Contact Me page.
Also, please post a review if you like the plugin.
The project is also stored at Post Volume Stats GitHub.
Future
-
Improve the page design.
-
Different ways to display the data graphically and different data to display.
-
Show differences between years, e.g. how the top tags change over the lifetime of the blog.
History / Development
"Post Volume Stats" started off as a very simple "Hello Dolly" type plugin, and it was going to be a plugin to show the stats to the public. At the beginning it just wrote a comment after the post with a list of the post volumes in it as you can see from the initial test, see the first screenshot below. Then, it became an admin area plugin with its own page where the data could be presented nicely.
There were originally lists with the charts, I found that the lists got in the way of the charts, especially on mobile platforms. If I had a lot of categories and tags they were always there, whether I liked it or not, and I had to scroll through them all to get to the next chart. Rather than just re-order the charts to have potentially large lists at the bottom, I decided to move the lists into AJAX popups. Then, no matter how long the list they are still available but on-demand. This freed up space, and seemed to work much better on mobile platforms.
The pie charts, bar charts and line graphs are all SVGs made with custom PHP.
I tried to use the WordPress way of coding as far as possible, using pre-existing helpers if they did exactly what I wanted. Often the helper functions were not quite what I was looking for so I did quite a bit of work with using the Wordpress codex database connection and my own custom SQL.
There is a script timer at the bottom of the page to show how long the script was working for. A small blog will probably be a few hundredths of a second whereas much larger blogs may be several seconds, depending on the number of posts. Selecting a specific year may also make things take longer because of the way the data is collected. I'm very interested to find out how quickly the plugin works for different blogs. Any feedback is much appreciated.
Plugin Progression Screenshots
These screenshots show examples of how the plugin looks and show the different stages of development. The screenshots I took never seemed to be as up-to-date as they might have been, the latest plugin is slightly different from the latest screenshots here.
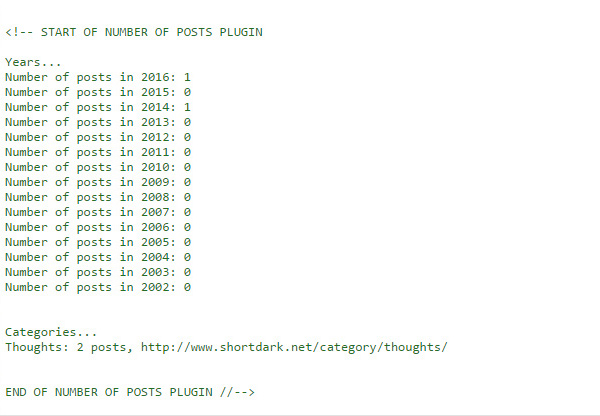
2016-07-03: Data presented as a comment in single posts.
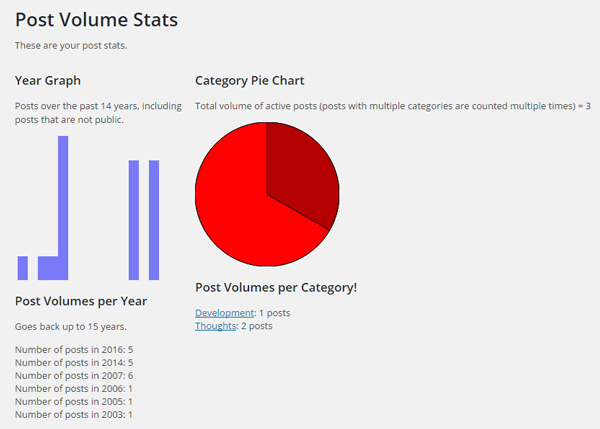
2016-07-13: Data presented as charts in the admin area.
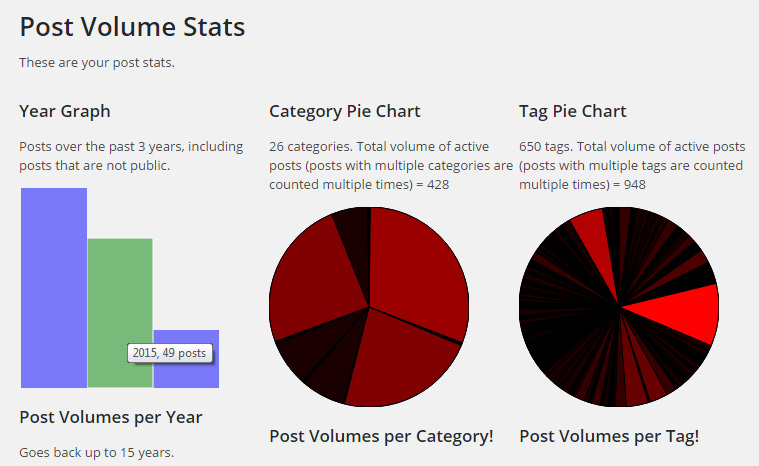
2016-07-14
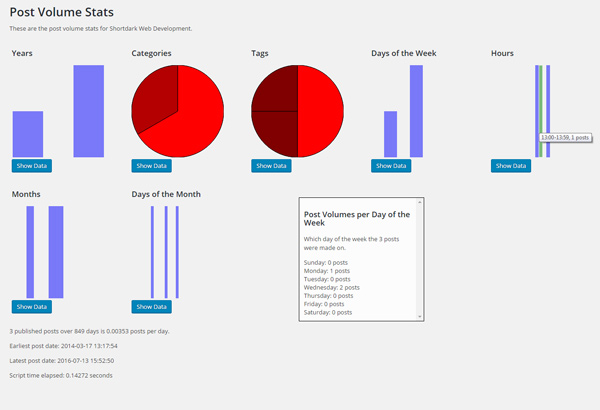
2016-07-28: More charts and draggable AJAX data lists
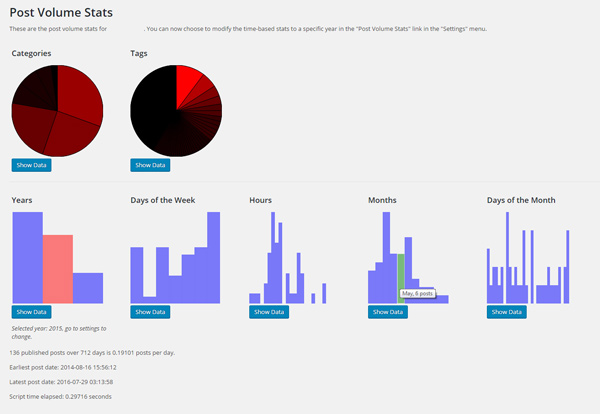
2016-07-31: Limit the time-based stats to a single year
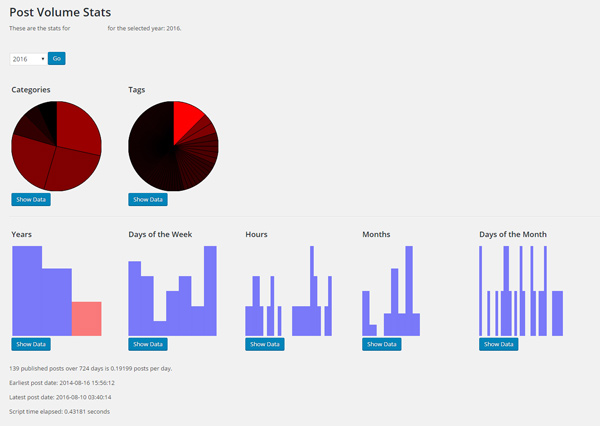
2016-08-14: Year selector moved to the plugin page and categories/tags are now limited to the year too.
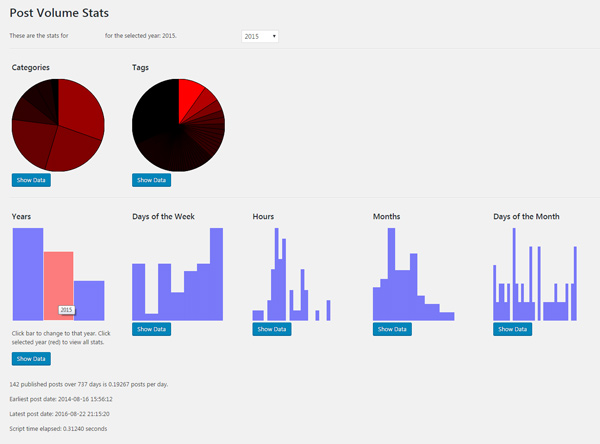
2016-08-28: You can now select a year by clicking on it on the "Years" bar chart.
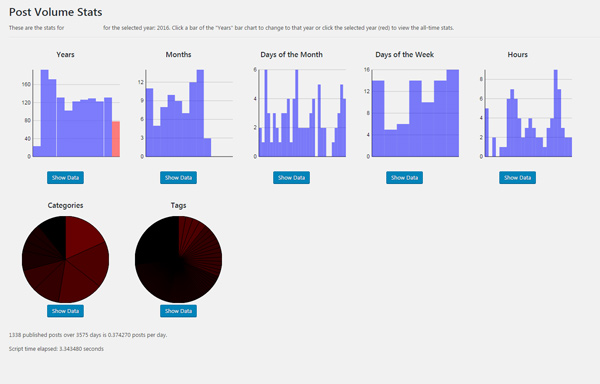
2016-09-04: Horizontal lines added to bar charts and subpages added.
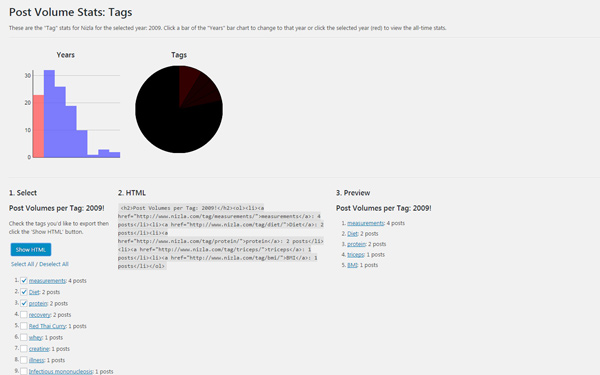
2016-09-04: Category and Tag lists can now be exported to HTML which can be copy/pasted into a blog.
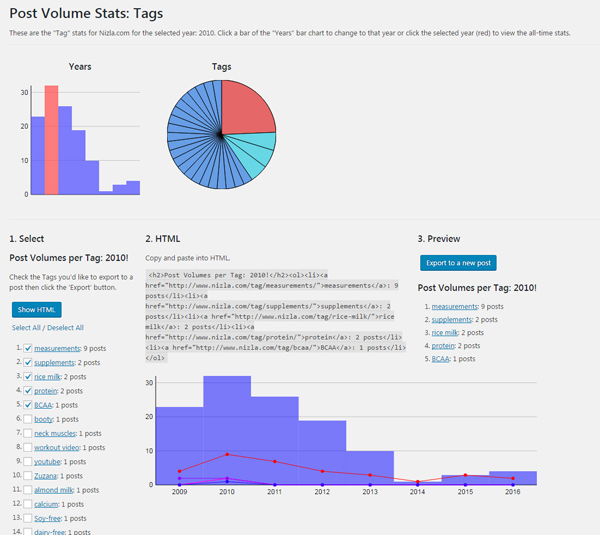
2016-10-05
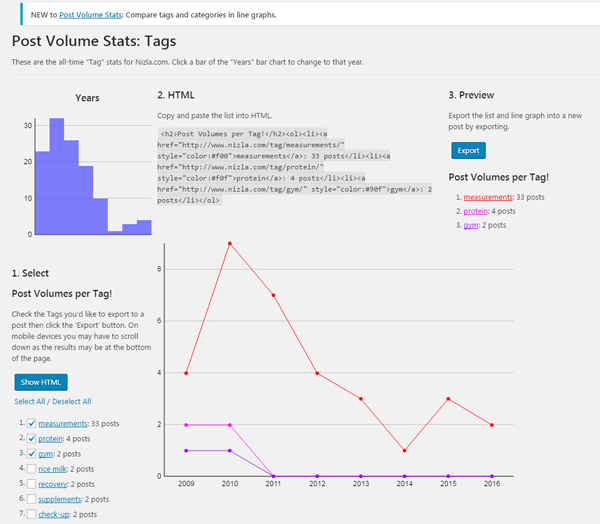
The "Category" and "Tag" pages allow the user to export the data into a list and a line graph. At one point the user had to copy-and-paste in order to export, this became an export button where you could choose to export the graph and/or the list.
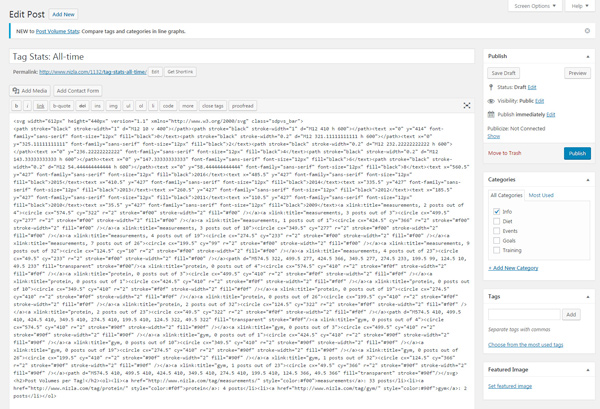
The export button adds the HTML list and line graph into a new blog post.
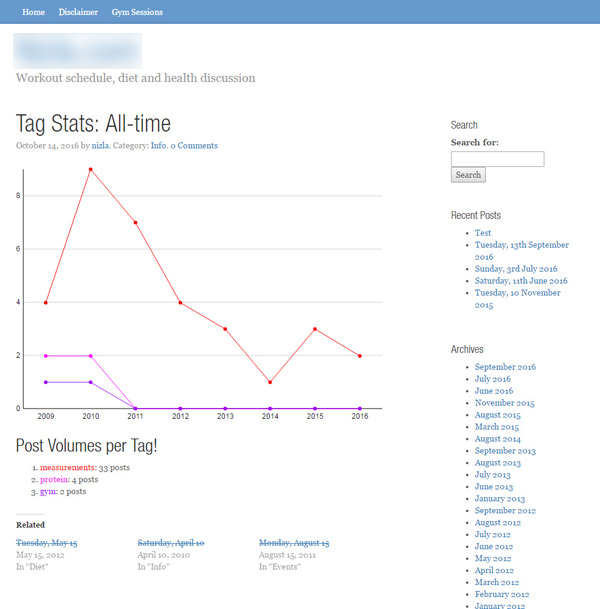
2016-10-14: Blog Post containing the exported data.
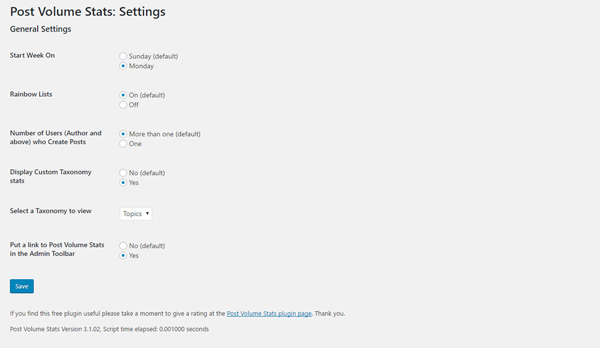
2017-01-16: New settings page.
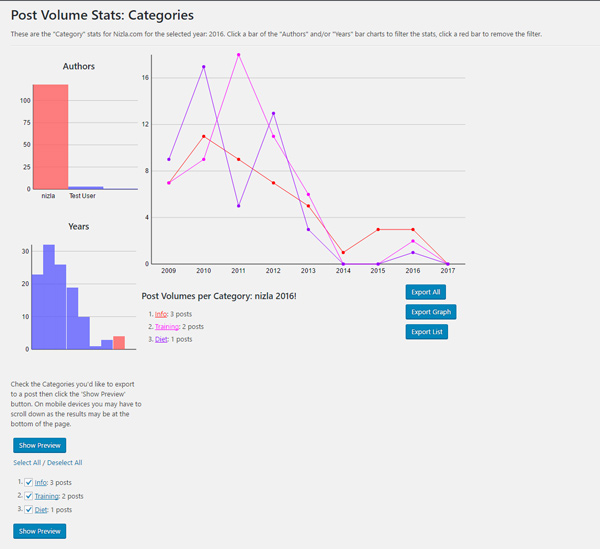
2017-01-16: Author filter on subpages.
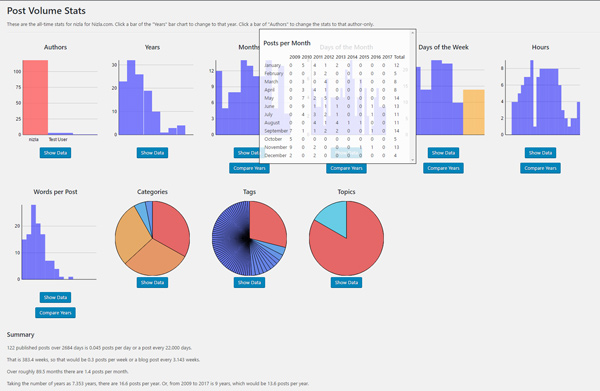
2017-01-16: Compare years.
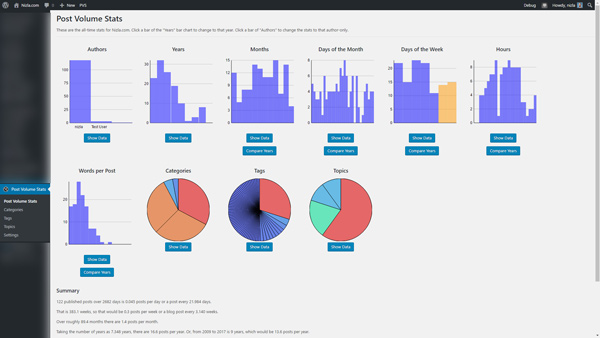
2017-01-16: Custom Taxonomy added to main page and also has it's own subpage.
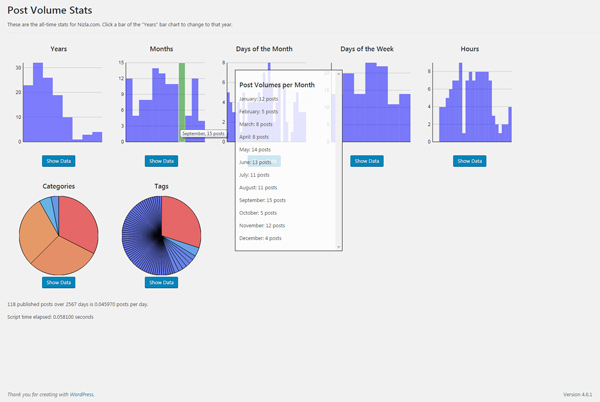
The draggable AJAX data lists, and highlighted bar of a bar chart.
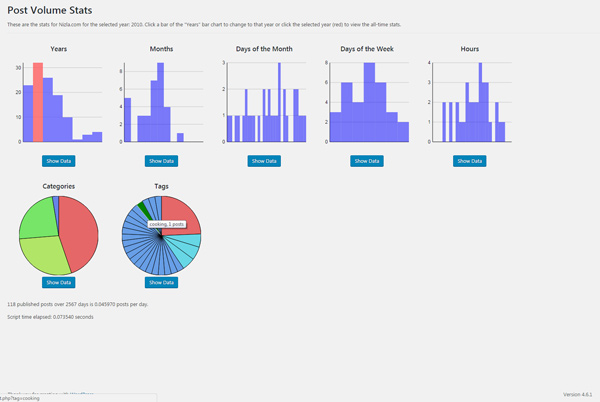
The same blog with stats for one year selected.
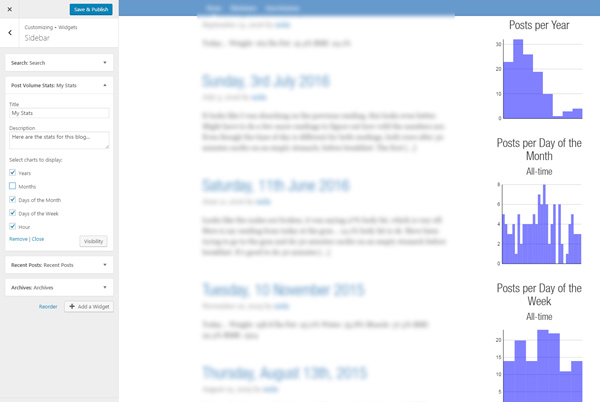
The widget in the "live preview" area of the admin.
