
Introduction
Renewable energy is one of those things that gets mixed up in politics, and when that happens it becomes more about people's opinions and emotions more than the actual facts. So, for a personal project I decided to look into the facts a little bit where I live in the county of Yorkshire in the United Kingdom. This is a case study to show the kinds of things I started looking into. Spoiler alert, more study is needed, but this is a nice starting point.
I've been interested in renewable energy for a long time, since studying engineering in the 1990's. I remember taking a module on renewable energy and one summer I volunteered at the Centre for Alternative Technology in Machynlleth, Powys. While my career didn't take me in that direction, I've been interested in how renewables have continued to improve and have become utilized, especially in the past few years. I had space for a personal project, so investigating the use of renewables in Yorkshire seemed like the perfect idea.
A note about the screenshots
All the images will be taken from different days, different stages of development. I'm not trying to show anything particular other than the changes I've made to the software.
Showing the Energy used in Yorkshire in different ways
First of all, I needed facts. Where do facts come from? Data!
I'd already been gathering weather data from Open Weather for some time so that seemed like a good place to start. I combined weather data from Sheffield (a city in South Yorkshire) with the carbon intensity data for Yorkshire from National Grid's Carbon Intensity. Straight away there is a mismatch there, I'm trying to compare the data for a whole county to the weather at a single point in one city.
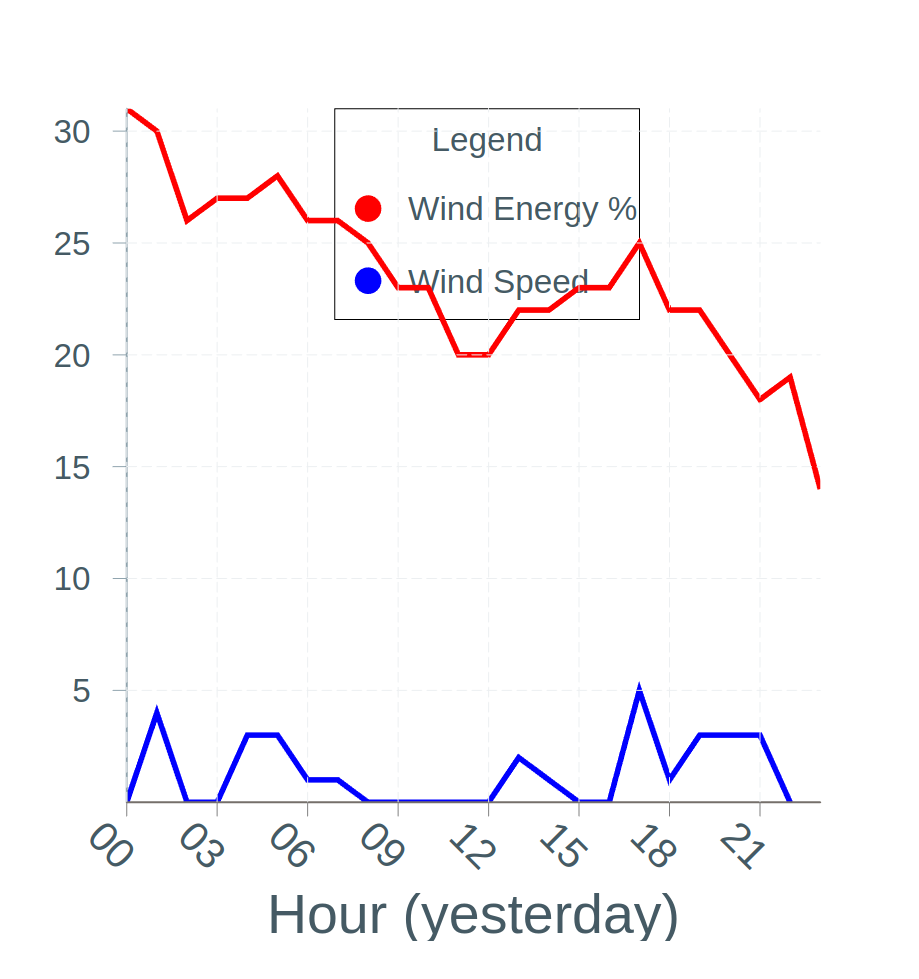
Here is the percentage of energy used in Yorkshire from wind energy vs the wind speed in Sheffield...
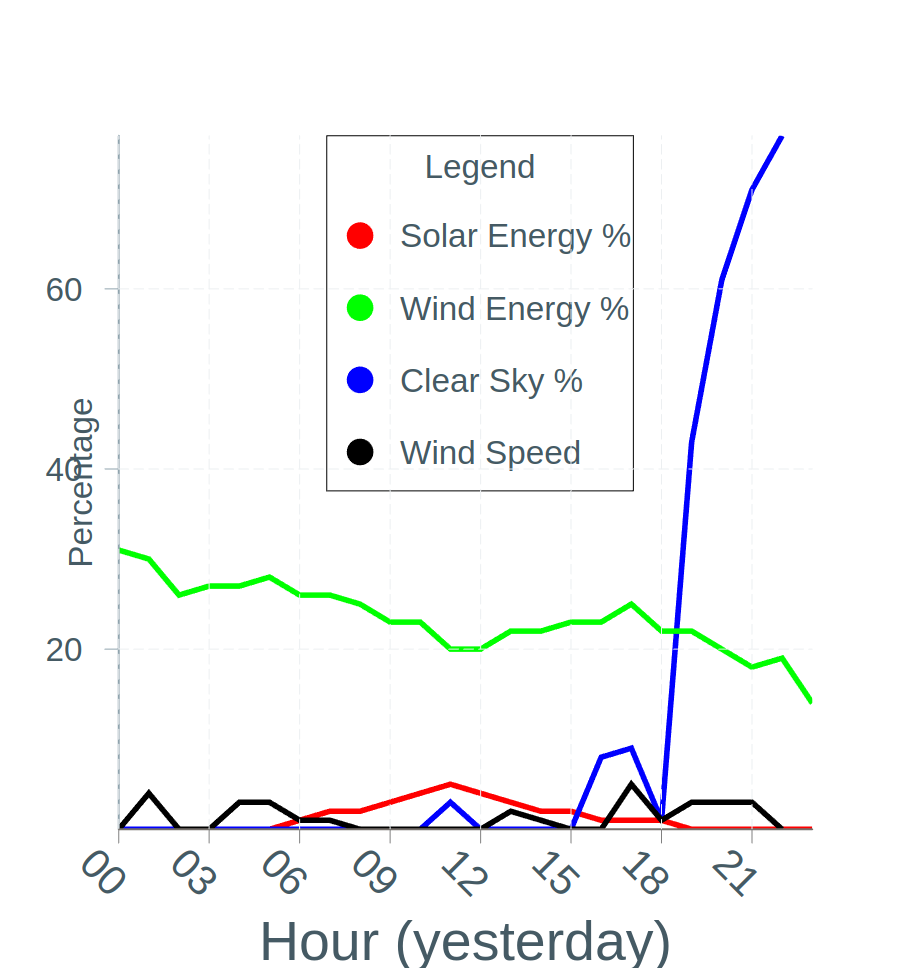
But, as well as the wind speed in Sheffield, I also had other weather data such as the temperature and the percentage of clouds in the sky in Sheffield. Instead of using the percentage of clouds in the sky, I converted it into a clear sky percentage, then plotted all four on the same graph...
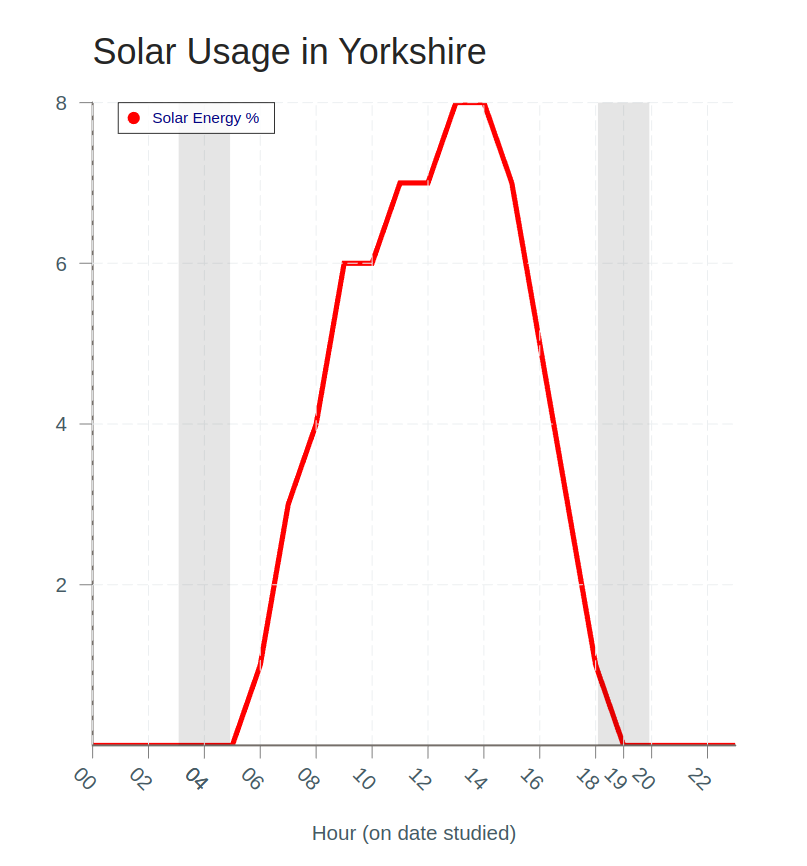
Having all four lines on the same graph was confusing, so I separated the wind from the solar, which gave a graph like this...
![]()
While the amount of clouds in the sky did make some difference, the main factor in solar is daylight. Solar panels can still work if it is cloudy.
So, instead of using the clear sky percentage, I decided to use the sunrise/sunset data from SunriseSunset.io instead. By this point, I'd noticed that some of the times were in BST and others were in UTC, so I began using all the data in the UTC timezone.
Even though, I'm getting the exact sunrise/sunset from the API, because the chart only uses whole hours that part is not particularly accurate, hence the wide bands...
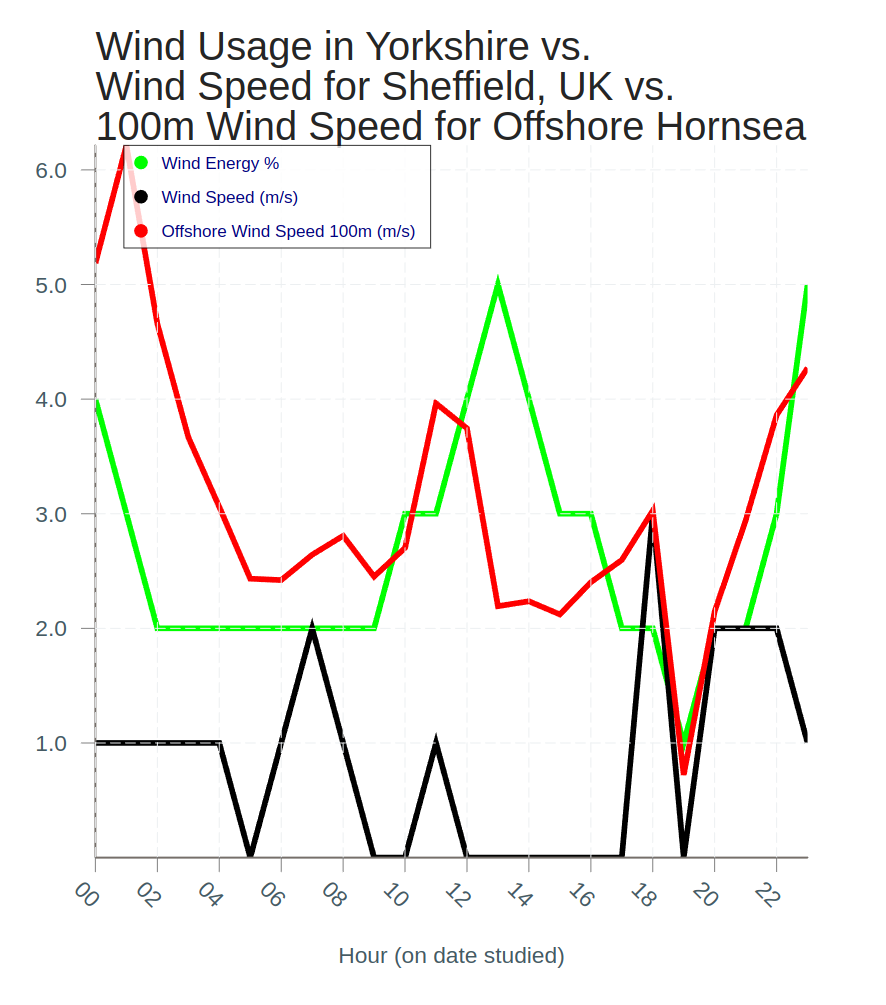
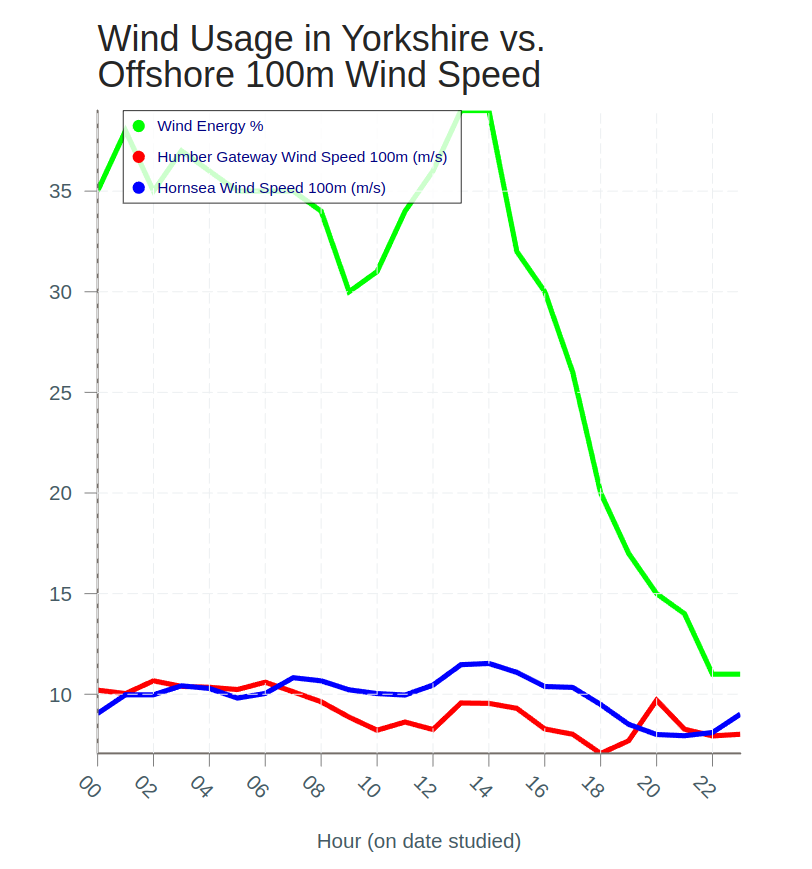
Going back to the energy from wind in Yorkshire, I decided that the wind speed in Sheffield might not be that useful when looking at the amount of wind energy created, especially as Sheffield does not have many wind turbines. So, I got some offshore weather data from Open Meteo, specified that it be in m/s, the same as the onshore data I had, and added it to the wind graph.
On this particular day, the wind energy percentage and the offshore wind speed around the Hornsea offshore wind farm are most closely correlated...
However, on other days the correlation is less obvious, even when showing two offshore wind farms Hornsea and Humber Gateway. Maybe there is still a correlation because when both farms are fairly constant at 10 m/s the wind energy percentage is fairly constant at around 35%, but when they start to drop off the wind energy percentage drops off a lot too...
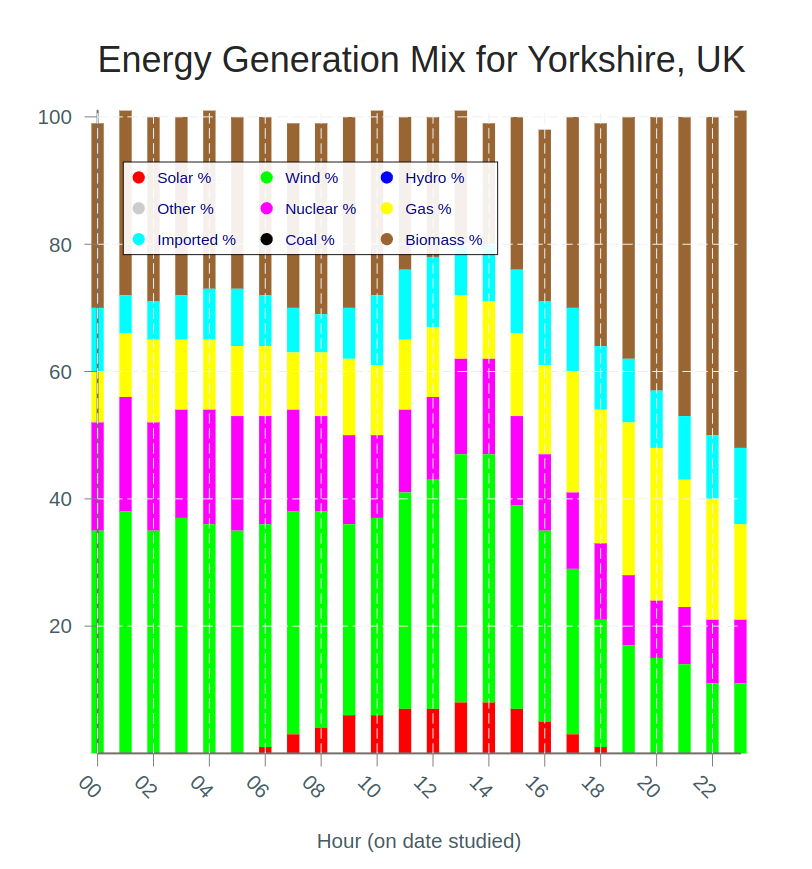
To show the mix of energy on any given date, I made a stacked bar chart with the carbon intensity data.
From studying various different days, there is often some quite surprising patterns. For a particular hour there can be a big change in the pattern, which goes back to normal the following hour. I do not know whether behaviour is what actually happened, or if it was a problem with the data.
For Yorkshire, Biomass tends to have the largest percentage, often around 40%. Then, everything else tens to be imports from other countries, gas, nuclear, wind and solar. That seems to be the mix, although I occasionally see a tiny bit of hydro. Having said that, there is quite a lot of fluctuation, I have seen days with hardly any wind energy, and days like this where biomass energy is down...
Biomass in Yorkshire will come from the Drax power station near Selby. From my research it sounds like general rubbish from the black bins, or things people put into the recycling bins that get rejected, are made into bricks that are burned at the Drax power station to create energy. This is apparently 80% better than burning coal, and I assume it reduces how much rubbish gets put into landfill.
I'm not sure why Biomass energy would be down unless it is as a response to their being more wind energy than normal. More research needed. But, that's the amount of energy created, the energy mix for Yorkshire.
But, as someone living in Yorkshire, I was quite interested to know where these various energy-producing facilities were on the map, especially so it'd be possible to go back to my weather data for Sheffield potentially.
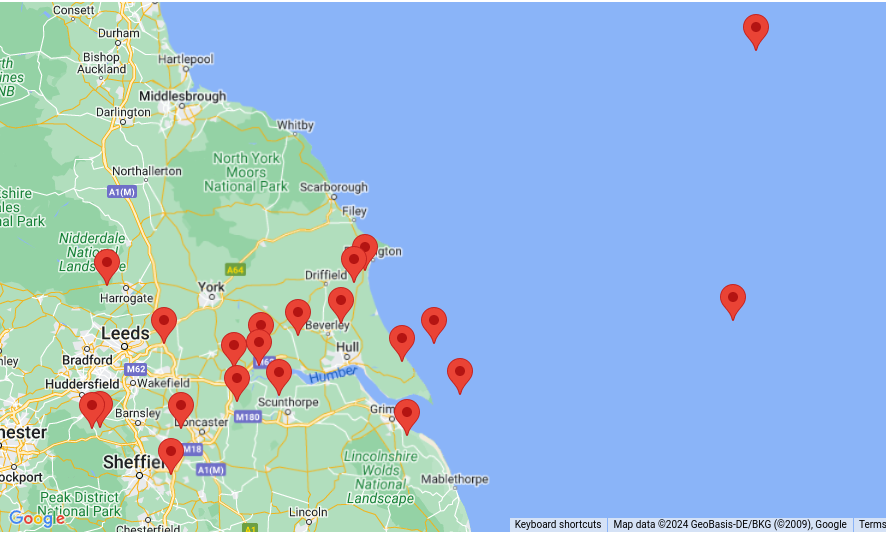
I did a Google search for solar farms in Yorkshire. The results were a mix of solar farms and businesses that fit rooftop solar...
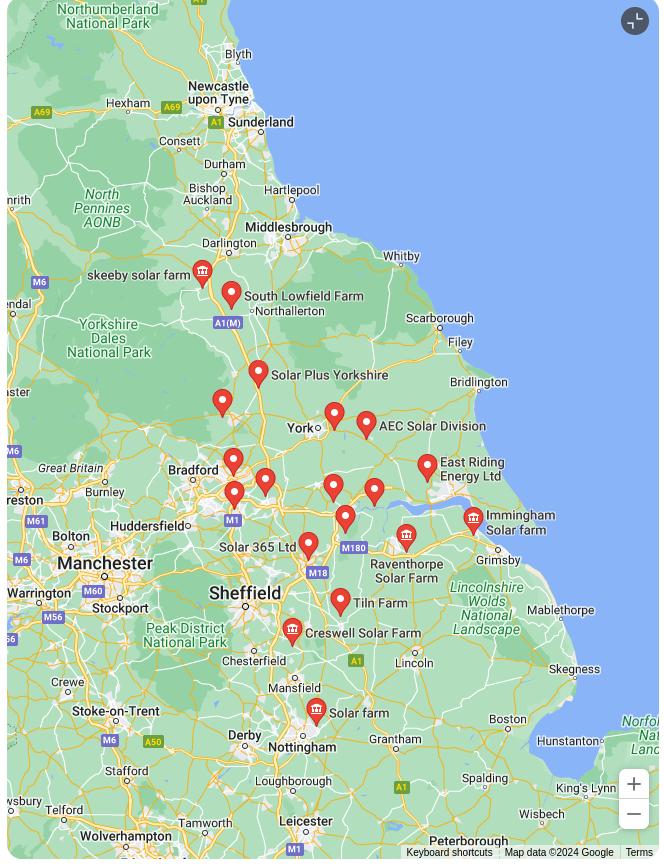
Grabbing the coordinates from solar farms that looked to be in/around Yorkshire, I plotted them on a map...
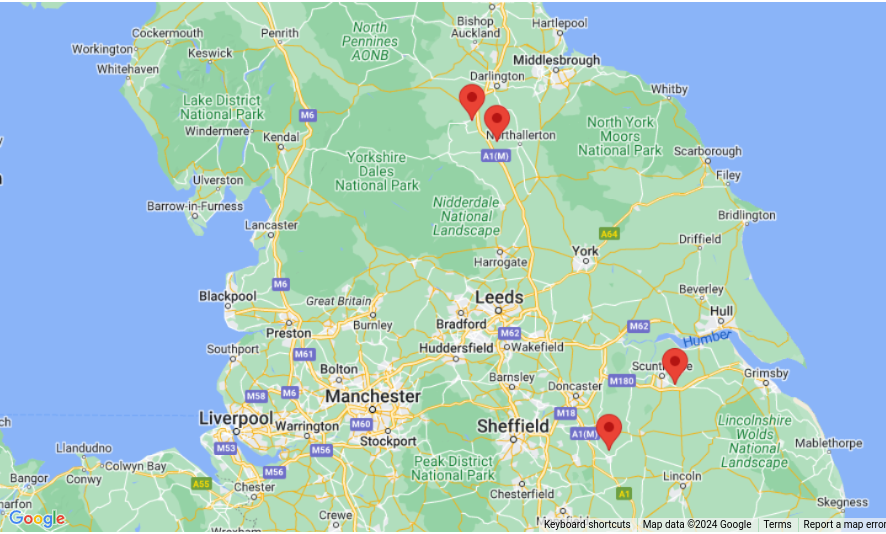
And did the same with wind farms...
But at this point I realised that I didn't know exactly where the Yorkshire region was. There were some facilities that I didn't know were in Yorkshire or not.
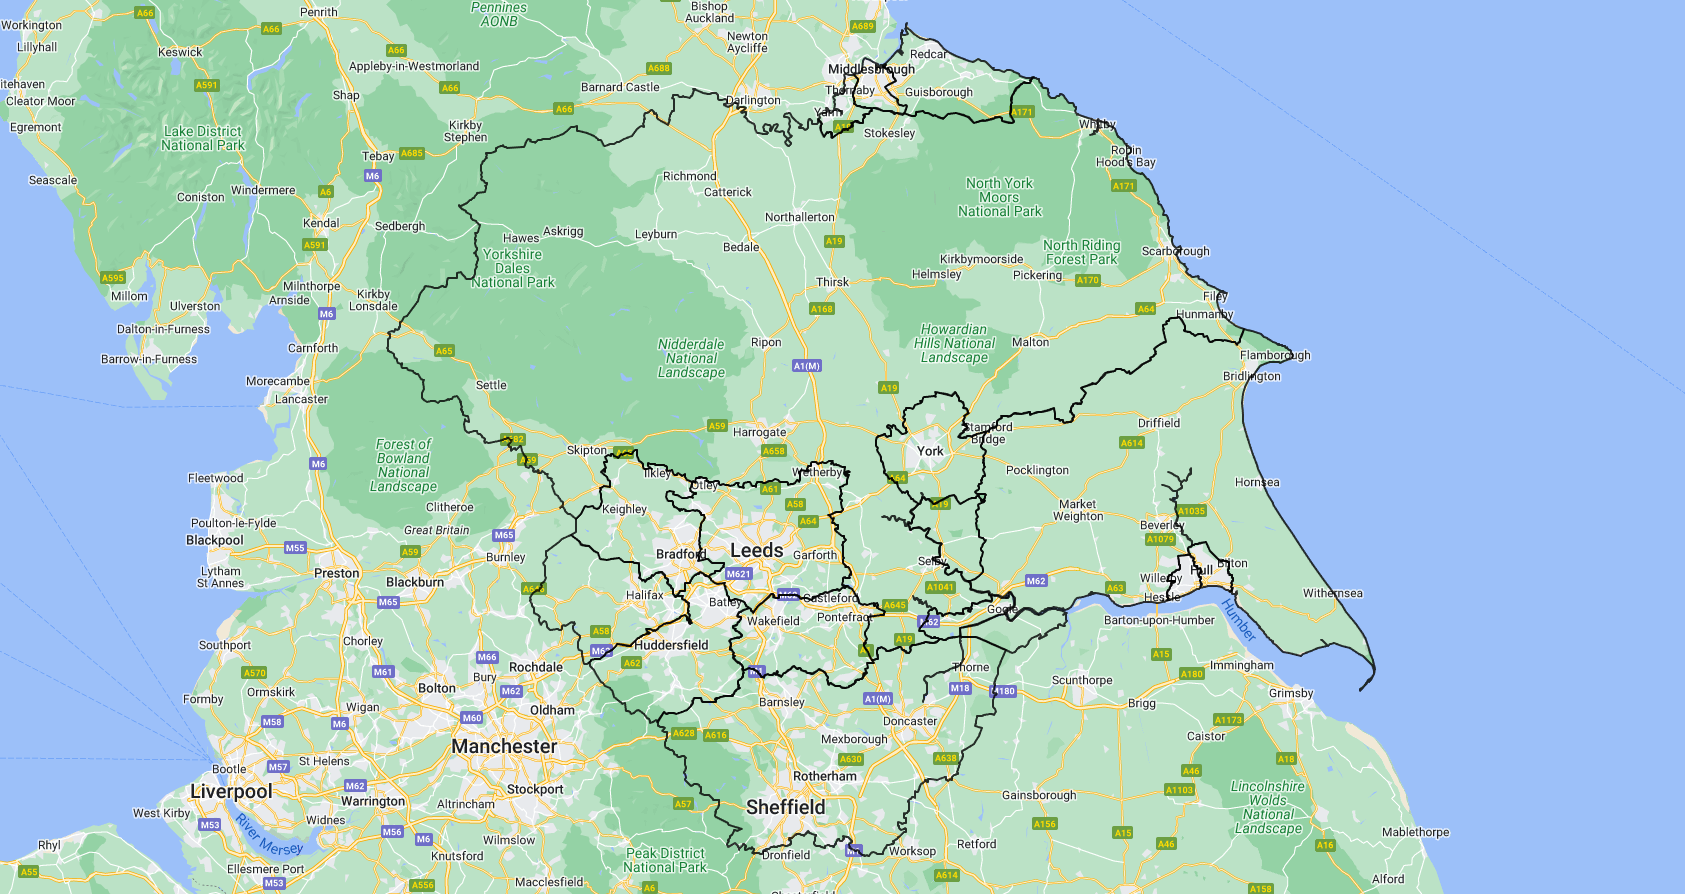
So, the next thing was to mark Yorkshire on the map. I needed the coordinates of Yorkshire, which I was unable to find. What I ended up doing was using whichever coordinates I could find for North, South, West Yorkshire and East Riding of Yorkshire.
Eventually, the coordinates I gathered looked like this on the map, which is hopefully close to what the actual border of Yorkshire is...
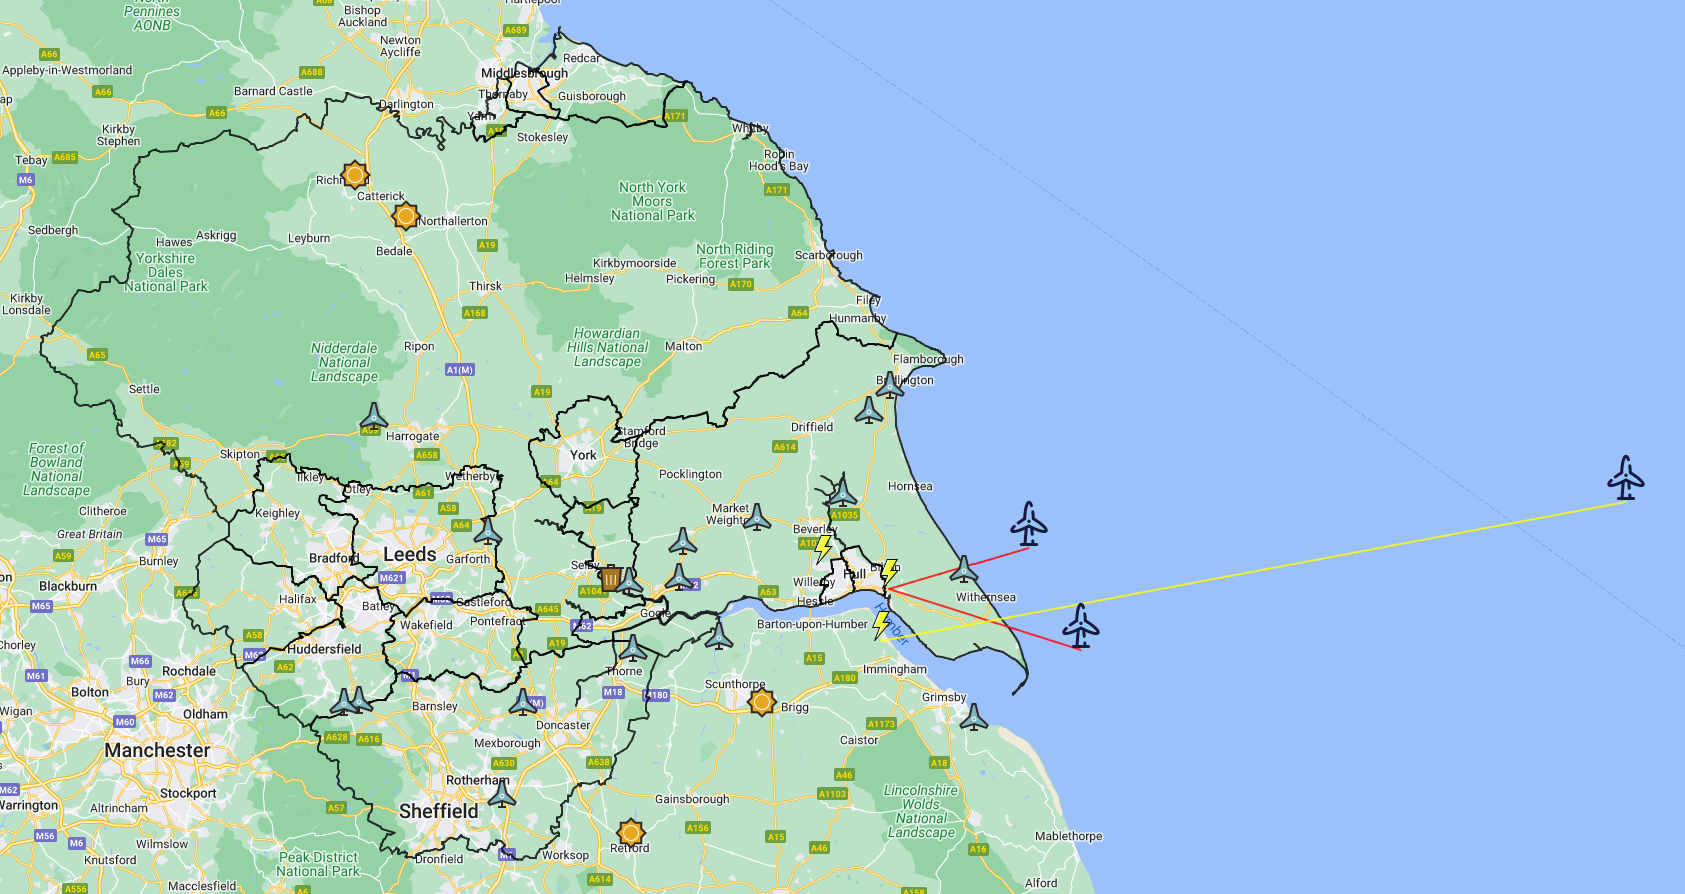
So now, with an outline of Yorkshire on the map, I could re-add the pins of all the renewable facilities onto the map. Having all the different facilities looking the same would be confusing, so I changed the icon for each type of facility.
With offshore wind, I'd previously put Dogger Bank on the map, but I believe that is not operational yet. Hornsea appears to be partly operational, and the two offshore wind farms closer to the coast are operational. To show where the energy from the offshore wind farms goes, there is a line from each offshore wind farm to the substation it is connected to. Hornsea wind farm connects to a substation outside of Yorkshire, despite the Hornsea being a place in Yorkshire.
The onshore wind farms don't stand out as much as I'd like, but it's ok for now...
What have I learned about Renewables in Yorkshire?
I had some specific technical goals, but in terms of the information I wanted to find out, the answer is that I really didn't know much to begin with. I was happy to learn anything. As such, I did learn some things, but also realised that my newfound knowledge opened a can of worms in terms of extra questions it opened up.
Yorkshire does not have a nuclear power station
While Yorkshire tends to have a fairly large percentage of its electricity coming from nuclear, I don't believe it has an actual nuclear power station.
This means that the nuclear power must be "imported" from another county. I use the word import very loosely, because it's not the same as the "imports" on the stacked bar chart.
Imports
The imports on the energy mix charts are from overseas. Imported energy can come from France, Belgium, Netherlands, Norway, or Denmark. Wales also receives imports from Ireland, but this will not affect Yorkshire.
It's good that imports are shown, but it'd also be nice to see if any of the energy generated in Yorkshire is exported overseas on any particular day. The UK generally, both imports and exports.
Biomass is renewable
I've learned quite a lot about Biomass, having know almost nothing from the outset. In particular, I know how it is used at Drax as there are a few variations. When talking about biomass there's a lot of crossover with recycling and how we deal with rubbish.
Having considered what Biomass is (burning bricks made from rubbish before it goes into landfill), I'm pleased I know about it. While it's similar to coal, and coal is bad, it's apparently 80% less pollution compared with coal. It's also presumably better as less waste goes into landfill, possibly more uniform waste which is less likely to cause subsidence. But this is speculation, needs more investigation.
Saltend, Cottingham and Killingholme
Saltend substation: It has an existing CCGT (gas power) plant and the Hull region looks like a hub for offshore with the two smaller offshore wind farms both feeding into Saltend.
Cottingham substation: will be the connection for Dogger Bank.
Killingholme substation: currently connects the first part of Hornsea. Technically not in Yorkshire.
Large offshore wind farms in construction
The first part of Hornsea is online, that's a large wind farm with a big capacity but there is plenty more being built. Similarly, once Dogger Bank starts to go online, each part of that has a large capacity and should increase the amount of wind energy a lot.
Currently, I believe only one part of Hornsea is online. If both Hornsea and Dogger Bank have 3 or 4 different parts then once all those parts go online that would potentially be a huge boost to the amount of wind energy, albeit that it depends on the wind speed.
Solar is hard to visualize because a lot may be rooftop solar
It looks like there are only currently two solar farms online in Yorkshire, so getting the amount of energy we do in Yorkshire from solar is fairly impressive.
I don't know how rooftop solar is handled by the data, if at all.
I also don't know whether Yorkshire is getting any energy from the solar farms that are just outside of Sheffield. I don't know how the grid works.
More solar in construction
I've learned recently that there is a new solar farm in construction near Dinnington, not far from Sheffield. It sounds like it will have a capacity of 49MW and will include battery storage.
Battery storage is one of the things this project didn't really enlighten me on. It's a potential area to look at in the future.
The Grid
In my independent studies of the data the one thing I don't know about is what the grid is doing. Is any of the energy produced getting sent to other counties or other countries? Is any energy being stored in batteries?
Really this whole project has produced more questions than answers. Perhaps, I won't be able to get all the answers I want to, but maybe I can find out a bit more.
What did I learn about the Software while doing the project?
I built the API in javascript, specifically: NestJs, and ReactJs. I'd used both before but it was another chance to get my hands dirty and try different things.
The project was a success in that I wanted to become a bit more comfortable in a few different aspects of javascript, which I did. By the end, the code was clear and concise. Managed to refactor out in a sensible manner.
In the same way that more questions were thrown up about renewables, I've discovered that there are also more technical things I'd like to try soon, in other projects.
I'd been planning to do slightly more with this project but something else has come along, so I'll leave it there for the time being. This project was originally going to be part app, but I'm really not sure what the app stores would make of an app like this, so it's maybe for the best that it won't be.